Jessie Moore has been writing professionally for nearly two decades; for the past seven years, she's focused on writing, ghostwriting, and editing in the finance space. She is a Today Show and Publisher's Weekly-featured author who has written or ghostwritten 10+ books on a wide variety of topics, ranging from day trading to unicorns to plant care.
A standard stock chart can only tell you so much. If you find yourself craving more indicators and visual tools to gain more market insight, Bookmap might be just what you’re looking for.
The Bookmap trading experience is geared toward active traders looking for an immersive overview of assets. It offers a wide array of unique features that help you visualize the action better while enabling you to trade stocks, ETFs, futures, and crypto.
However, if you’re new to Bookmap, the sheer volume of features can be intimidating. It can also be challenging to discern whether tools like its famed volume bubbles are gimmicks or truly useful.
In this Bookmap review, we’ll take a look at all of the platform’s features and offerings so you can figure out whether or not it’s right for you.
Bookmap Review: Is it Legit and Worth it in 2025?
Overall rating: 4/5
The bottom line: Yes, Bookmap is legit. It also goes way beyond your average stock charting platform.
Bookmap fulfills seldom-met trader needs, such as 40-frame-per-second zoom, which allows you to see and react to minute market developments — as well as unique analytical indicators that let you assess current order book imbalances, review large lot orders, and much more.
Built with day traders in mind, it’s loaded with features that can help you catch things other platforms won’t. For instance, the aforementioned nanosecond zoom feature lets you see the fastest stock movements and most minute details so you can analyze stocks with a greater degree of accuracy.
I won’t lie — Bookmap can be intimidating for beginners. If you’re just getting started, it might be worth your while to get up to speed on charting basics before you dive in.
But if you’ve been around the block and want things like a better view of order flow, you’ll love Bookmap.
My biggest complaint? Some of the best features are locked behind paywalls — so be sure to double-check that the pricing tier you choose is loaded with the features you really want before you subscribe.
What is Bookmap?
Bookmap is a trading platform designed primarily for day and high-frequency traders. What really puts it on the “map” is an impressive array of unique features — for instance:
- Heatmaps focused on liquidity and geared toward helping you better visualize market data.
- Similarly, Volume Bubbles help you gauge the current buying and selling trends, tracking both the intensity and direction of trading pressure.
- It also offers millisecond price analysis on stocks, crypto, ETFs, and futures, allowing you to instantly see changes, no matter how large or small.
Additionally, Bookmap boasts a robust learning resource library. You’ll get access to some iof it with a free account, and full access with a premium account.
How Does Bookmap Work?
Bookmap combines multiple tools and resources for traders into a single platform. It has high connectivity with a large number of data providers and exchanges including TradeStation and Interactive Brokers (for stocks), Binance, Coinbase, and Kraken (for crypto), and dxFeed and Rithmic (for futures).
The information is expressed through a variety of interesting indicators to help you analyze the market better. Its most eye-catching features? The heatmaps and volume bubbles.
While many of its features are available with the free Digital package, more become unlocked with higher tiers.
Market data — save for crypto — is delayed with some subscriptions. This may not be a huge deal for some traders, but for others, such as scalpers, this could make a big difference. Be sure to choose a plan that suits your needs.
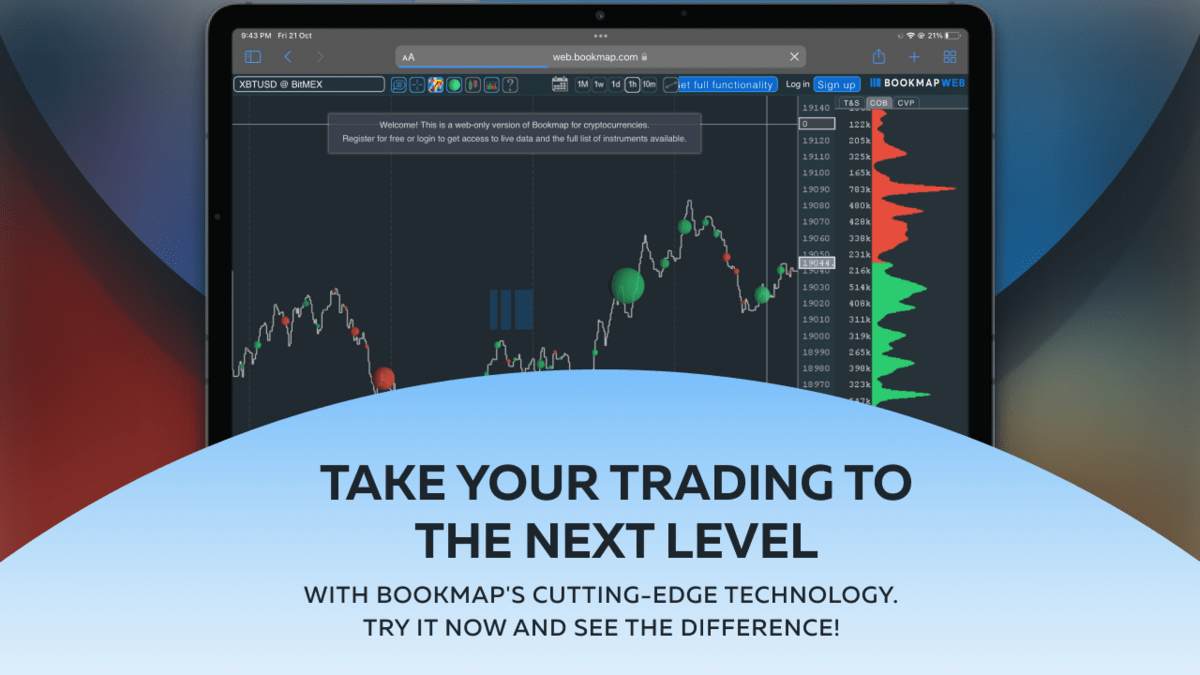
Bookmap Software: Real-Life Example
Bookmap software is not available for mobile. Apart from that, you can download it on your computer whether you are running Windows, Mac, or Linux.
So — you want to test out the platform. What happens once you boot up?
First, Bookmap will offer you three modes in which it can run — simulation, trading, and replay.
Personally, I was overwhelmed at first with all of the different visual tools. It’s fairly intuitive, but it does require a learning curve, so I suggest running it in simulation mode for a while.
If you have a paid plan, be sure to check out the Record/Rewind mode. You can view this mode as another kind of simulation as it enables you to view previous actions and even simulate trades on these snapshots.
Additionally, if you are an algo-trader, it helps you test whether you created a winning strategy.
These modes can help you get familiar with the interplay between Bookmap’s many features, like the Icebergs tracker, which can step up your order book game.
(Don’t worry — we’ll talk more about the features in a minute.)
While it initially appears there are too many tools and indicators, once you see them actually interact you’ll quickly start getting a handle on things. Let’s continue the Bookmap review by talking more about the Bookmap trading experience and its many features.
Bookmap Features
Let’s look at what each of its many features actually does.
Bookmap Order Flow
Bookmap gives you a clear and precise view of the order flow. Its data gets refreshed 40 times each second providing an almost instantaneous insight into what the market is currently doing.
This speed pairs with Bookmap’s outstanding visualization tools like its heatmaps and Volume Bubbles. You can get the information you need at a glance and have the opportunity to act ASAP.
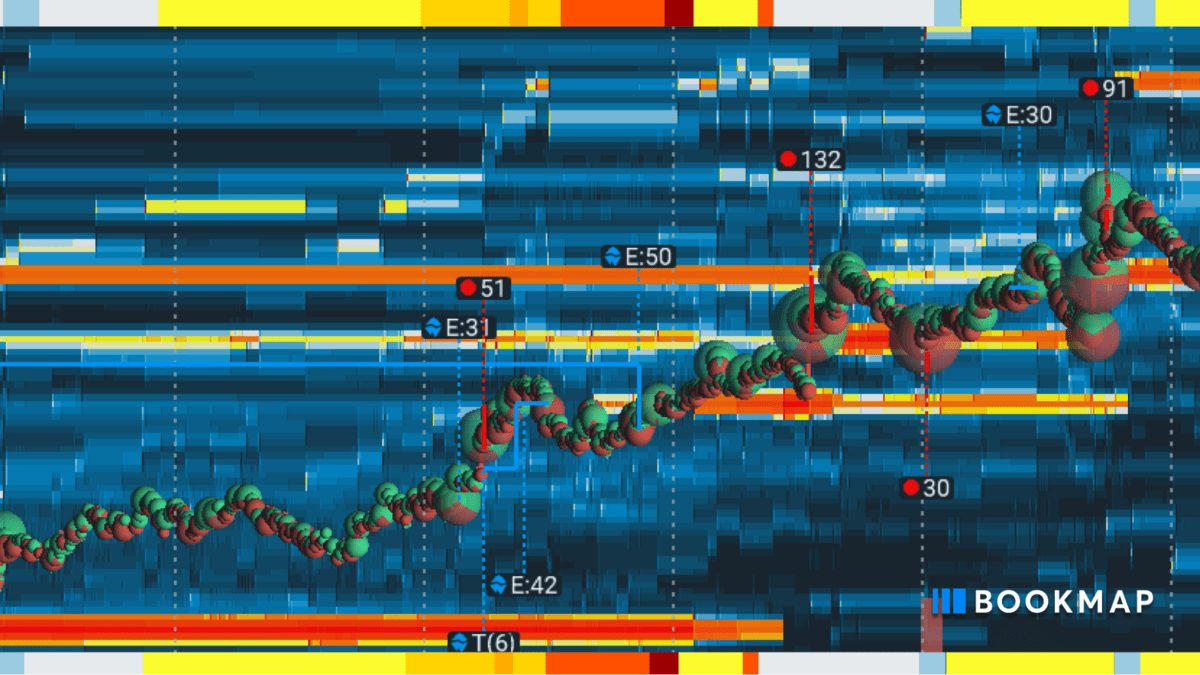
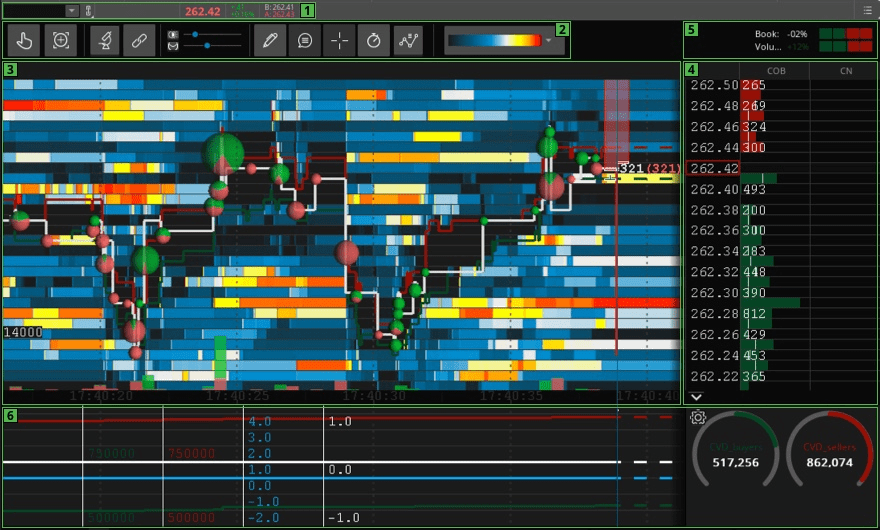
Bookmap Heatmap
Bookmap’s heatmap is specifically designed to display the liquidity of an asset at various price levels. The heatmap updates in real-time, utilizing color to indicate liquidity levels — a lighter shade represents lower liquidity and a darker shade corresponds to higher liquidity.
Heatmap visualization has a good degree of accessibility as it features three default color schemes and can be customized further.
This feature can help you identify the current support and resistance levels in real-time, which can help you execute the right trade at the right moment.
Candlestick Charts vs. Heatmap
Heatmap visualization is also designed to boost your view of the market compared to the popular candlestick chart as the latter offers no insight on the current liquidity or spread.
But be mindful — the heatmap becomes more useful the more familiar you are with it, and it can be significantly harder to read than a candlestick chart at first.
The heatmap is designed to offer a lot of information within a single screen. Don’t be overwhelmed — it can be treated as supplemental to the more traditional charts rather than a replacement.
Customizable Charts
Don’t worry — Bookmap does not shun the more traditional charts. It offers all of the most popular ones, including candlestick, line, and bar charts.
Here’s a cool feature: Bookmap allows an impressive zoom capability, going down to the nanosecond level. This unprecedented detail can be crucial for high-frequency traders needing granular data.
Charts can also be customized with various indicators making them potentially very complex and very rewarding to use.
Current Order Book
Bookmap’s Current Order Book (COB) is the graphical representation of the values of current pending orders. This can help you figure out the support and resistance levels for the asset you are interested in by seeing the visual representation of the liquidity at various price points.
It can also help you identify opportunities created by the appearance of large participants in the market.
It can be set to numbers and percentages and also come in two additional flavors — aggregate display and extended display.
Best Bid and Offer
Bookmap also features a real-time display of the current best bid and offer (also known as spread) for the asset of your choosing.
This tool can help you keep a close eye on liquidity and enable you to identify possible points of absorption and exhaustion.
You can also view the best bid and offer figures for a certain period in the past on Bookmap — usually, either hours or days, giving you more context about the recent behavior of an asset.
Volume Bubbles
Volume Bubbles are another of Bookmap’s interesting visualization solutions. They are, quite literally, bubbles that grow in size as the volume increases. They’re color-coded with red bubbles indicating selling pressure, and green ones buying pressure.
You can also zoom in on individual bubbles to view the action as it unfolds.
Like many of Bookmap’s other features, Volume Bubbles help you determine which way the wind is blowing and whether the sell orders are close to overwhelming the buyers and vice-versa.
Along with gauging bullish and bearish sentiment, bubbles are an invaluable tool for figuring out the likelihood of an order getting successfully executed.
This holds true whether you are zooming in fairly closely to get the details, or trying to see the bigger picture by keeping an eye on multiple bubbles over the number of intervals of your choice.
Record/Replay
The market moves fast. It can be difficult to properly analyze the action as it unfolds. Thankfully, Bookmap features a record/replay function with which you can, as the name implies, record and then replay the previous action.
The tool also plays into paper trading on the platform. That means you can simulate trades on the recordings.
Nanosecond Zoom
Bookmap offers the very useful ability to watch the market move at 40 frames per second. Adding to this, it also features a nanosecond zoom helping you see and react to even the fastest and smallest developments on the market.
Multi-Asset Coverage
Bookmap offers a wide variety of assets that you easily switch between, including stocks, ETFs, futures, and crypto. However, options and bonds are not available on the platform.
Unique Analytical Indicators
In addition to the more basic tools (albeit with some unique twists), Bookmap also offers a selection of unique analytical indicators:
- Imbalance Trackers: The imbalance tracker gives you an easy-to-read snapshot of the current order book imbalances. This, in turn, helps you accurately gauge the current market sentiment.
Combined with the speed and precision of Bookmap’s data, this can significantly help you take advantage of ongoing anomalies as order book imbalances tend to be corrected quickly for assets with good liquidity.
- Strength Level Indicator: Designed primarily for day traders, this tool is aimed at providing additional insight into liquidity and support and resistance levels by showing the actual number of transactions that occurred in a specific timeframe.
- Large Lot Tracker: The Large Lot Tracker (LLT) helps you see who the big traders are when it comes to a given asset by showing you the players behind the largest number of contracts.
- Stops & Icebergs Tracker: While the LLT tells you who is the biggest player, the Icebergs Tracker will identify orders placed by these traders that have been split into multiple smaller orders.
This, in turn, enables you to detect sudden opportunities coming from large market participants even before their impact is visible to many of your competitors. On the flip side, the tool is also helpful with detecting spoofs and other abusive behavior so you can avoid bad trades.
Integration of Algorithmic Trading
Bookmap also offers excellent integration and utility for algorithmic trading.
First, the Record/Replay feature I mentioned earlier pairs well with the platform’s general customizability. If you’re tech-savvy, it also enables you to test out your algo models.
Additionally, Bookmap provides an API to better facilitate add-on development and further integration of algorithmic trading strategies. It also offers a Java API for those of you who wish to create and implement custom indicators.
Broker Compatibility
Bookmap offers a decent, though not amazing, selection of compatible brokers for stocks and futures. Some of the more prominent among these are TradeStation, Interactive Brokers, dxFeed, and Rithmic.
You can also access Bookmap through other platforms like TD Ameritrade’s Thinkorswim.
Additionally, since Bookmap also offers support for cryptocurrencies, it is compatible with multiple major crypto exchanges including Coinbase, Binance, and Kraken.
Educational Resources
Bookmap offers a wealth of educational resources. These include a number of text-based and video guides and webinars. While many of these resources are accessible with a free account, or even without an account, some of the more advanced ones require a premium subscription.
Bookmap also has a thriving community of traders centered around its Discord server.
How to Get Started With Bookmap
Starting out with Bookmap is a relatively easy process — really, you just need to download the software and create an account.
Bear in mind, during the sign-up process, you’ll receive a license key via the email linked to your account.
Bookmap’s software can run in three modes — simulation, replay, and trading. Don’t be alarmed if you can only access the simulation when opening it for the first time: it is standard procedure.
You can choose to open a free or premium account; personally, I recommend first trying the free version to get a feel for it. Bookmap is especially beneficial for scalpers, day traders, swing traders, or algorithmic traders, but may not suit everyone’s style.
Bookmap: Customer Service Options
Bookmap offers two main forms of customer support.
The chat feature is always available and is generally able to solve all of the simpler problems you might encounter.
For more complex issues or if you find yourself really stuck, remember that Bookmap also provides phone support on a call-back basis. You can leave a message, and you can expect a callback between 9 a.m. and 5 p.m. EST.
Bookmap Pricing
Bookmap offers multiple types of accounts, both free and paid.
The platform’s free tier is called the “Digital Free”. Frankly, I think it is pretty great as it gives you the opportunity to test out several of the platform’s unique features, which can help you gauge if a paid subscription is worthwhile.
It boasts real-time data for crypto, delayed market data for futures and stocks, and access to heatmaps and a host of other volume-analyzing tools.
But if you really want to get serious with the platform, you’ll probably want a paid account.
The “Digital Plus” is the lowest paid tier at $19/month. Its offerings are an expanded version of the free tier, including a selection of price-centric tools, as well as one-click crypto trading and the Record/Replay feature. It also gives you access to the consolidated order book (multibook) and increases the number of simultaneous trading symbols you can track.
The “Global” tier is more than twice as expensive at $49/month. But it also provides access to almost all of Bookmap’s features while also raising the number of trading symbols you can track simultaneously from 2 to 10.
It is also the cheapest tier that gives you access to real-time data for futures and stocks. If this package seems right for you, you can gain lifelong access to it for $990 through a special offer below, which also includes a one-year access to the free add-on package.
The most tricked-out tier is called “Global Plus,” which costs $99 per month — but right now, if you click this link, you can get a special offer where you can nab the first 3 months for $147.
This subscription unlocks many more customization options, more unique analytical indicators, and gives you access to one-click trading for stocks and futures.
Bookmap Vs. the Competition
So, now we know that Bookmap’s offering is unique and rich. But how does it stack up to the competition?
Bookmap vs. TradingView
Although Bookmap aims to provide an alternative to conventional charting, that doesn’t mean traditional charts have lost their usefulness.
TradingView is one of the most popular – if not the most popular – charting tool out there for good reason. It offers real-time feeds and a wide array of alerts and indicators to fulfill many of your needs.
Interestingly though, TradingView and Bookmap can work well in conjunction as long as the latter’s powerful and customizable visualization tools work for you. TradingView compensates for Bookmap’s relative lack of traditional technical analysis tools.
On the flip side, you can meet many of your technical analysis needs using another platform like Thinkorswim which has direct integration with Bookmap.
To sum things up, the two platforms are rather different beasts.
- If you just need great charts without premium tools, TradingView might be right for you.
- If you’re looking for a more sophisticated experience with extra visualization tools and scalping/day trading tools like subsecond zoom, Bookmap is a better pick.
Bookmap Vs. TrendSpider
TrendSpider is a fairly unique platform as it offers very advanced automation capabilities and is primarily geared toward strategies involving automatic technical analysis.
Both platforms have a significant price and require a steep learning curve. Additionally, both offer support for extensive automation — though TrendSpider definitely excels at it — and both provide some unique ways of visualizing the market.
That being said, while also catering to active traders, TrendSpider’s offering is markedly different than Bookmap’s.
- If you’re looking for sophisticated automation and algorithmic trading tools, check out TrendSpider.
- If you’re looking for a more robust suite of tools to gain better insight behind stock moves, Bookmap is your top pick.
Bookmap Vs. NinjaTrader
NinjaTrader is widely regarded as one of the best platforms for future traders looking to keep their costs low. Additionally, it is a good fit for professionals due to the degree of customizability it offers and for beginners thanks to its easy-to-read interface.
Ninja Traders offers a great, free, day trading simulator while Bookmap’s most appealing feature for testing out your strategies — the Record/Replay function — is kept behind a paywall.
- NinjaTrader’s lifetime plan is cheaper than both higher tiers of Bookmap — so if budget is a concern, that’s worth noting.
- However, as previously mentioned, Bookmap’s unique features like the sub-second view and visualization tools can make the platform well worth the investment, if these aspects align with your preferences.
Bookmap Pros & Cons
Bookmap Pros | Bookmap Cons |
A host of unique features for better visualization of market depth and liquidity. | The sheer number of features can be overwhelming. |
A high degree of customization. | The uniqueness of visualization options can be hard to get used to and even off putting to some. |
Multiple accessibility options. | Premium packages are pricey. |
Ability to detect and track large players as well as icebergs. | Many of Bookmap’s best features are available only with a subscription (and many of them only at the highest tier) |
A free account tier that enables you to test some of the platform’s more unique features before buying. | A free account provides access only to real-time data on crypto, and permits one-click trading exclusively for crypto. |
Ability to look at the market at 40 frames per second and zoom in to nanosecond level. | No app for smartphones. |
Access to API enables algorithmic trading and additional customization. | Lack of traditional technical analysis capability. |
Compatibility with multiple brokers and data providers. | |
Offers stocks, futures, ETFs, and crypto. | |
Ability to record and replay past market action and create simulations based on it. | |
Is accessible through other platforms as in the case of Bookmap Thinkorswim. | |
Highly-readable heatmaps and charts once you get used to Bookmap’s style. |
Final Word: Bookmap Review
Bookmap is a platform unlike any other.
It has a ton of value for day traders, algorithmic traders, swing traders, and scalpers with a keen interest in information pertaining to market depth. Additionally, its visualization solutions are unique and the 40-frame-per-second view helps you keep pace with the fast-moving market.
However, Bookmap might not be the go-to platform for everyone. Given that some features are exclusive to higher price tiers, it may not suit more casual or low-frequency traders.
But if you’re an active trader looking for advanced tools that you won’t find anywhere else, Bookmap is well worth a try. And right now, you can try the top tier at an incredible price.
FAQs:
What is Bookmap?
Bookmap is a trading platform designed primarily for day and high-frequency traders. It offers liquidity-tracking heatmaps, volume-tracking bubbles, highly-customizable charts, dozens of data sources, educational resources, and a treasure trove of other tools designed to help you see market activity both quickly and clearly.
Is Bookmap any good?
Bookmap is a great platform for active traders seeking ways to benefit from greater insight into market depth. It also offers great tools for identifying and tracking large market players, as well as highlighting spoofs and sweeps. That being said, it has less to offer to more passive traders or those who simply don’t like its design or the hefty price tag hiding the best features.
Does Bookmap cost money?
Bookmap offers a free plan called “Digital Free” which gives access to multiple features such as real-time crypto market data and its heatmaps. This gives you the opportunity to figure out if one of its premium subscriptions is right for you. Mind though that most of its best features indeed require premium accounts.
Where does Bookmap get its data?
Bookmap gets its data from a host of data providers. These include Rithmic, dxFeed, Omnifeed, TradeStation, Interactive Brokers, Binance, Coinbase, and dozens of others.
Is Bookmap free?
While Bookmap offers a “Digital Free” plan that provides just enough of its features that it can work well as a demo account for you, most of its best and most useful features are locked within its three premium subscription plans. Its best and most complete plan is, simultaneously, its most expensive one.
Where to Invest $1,000 Right Now?
Did you know that stocks rated as "Buy" by the Top Analysts in WallStreetZen's database beat the S&P500 by 98.4% last year?
Our April report reveals the 3 "Strong Buy" stocks that market-beating analysts predict will outperform over the next year.